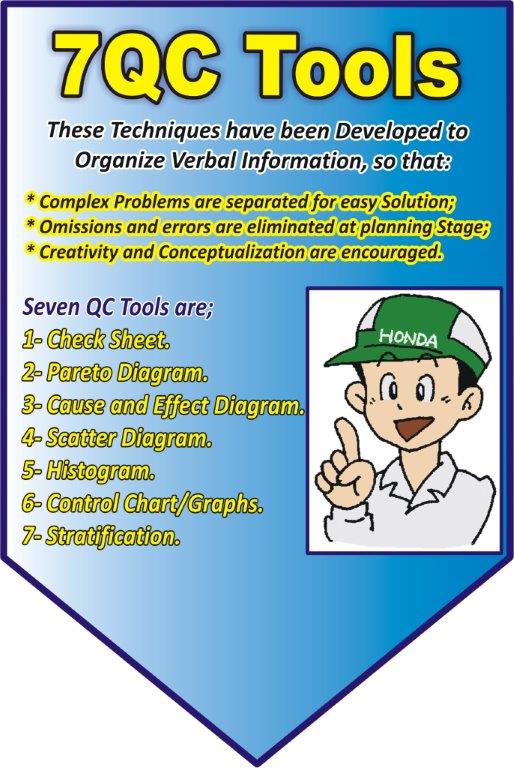
These techniques or tools have been developed to organize verbal information that helps organizations recognize and resolve issues with quality. These resources are beneficial to both the manufacturing and service sectors so that
- Complex problems are separated for easy solutions by using these tools.
- Omissions and errors are eliminated at the planning stage
- Creativity and conceptualization are encouraged
Types of Tools
There are seven types of QC Tools named as
- Check Sheet
- Pareto Diagram
- Cause and Effect Diagram
- Scatter Diagram
- Histogram
- Control Charts/Graphs
- Stratification
Check Sheet
This is a form of the framework and items are prepared beforehand so that while reviewing the facts, they are easily entered as Data.
Purpose
Investigation check sheets check the problem condition. The cause of the problem can be captured.
Recording check sheet check (inspect) whether what is decided is at the normal condition, and then retain it as a record
Example

Pareto Diagram
Categories reject or return in quantity or cost, and display them with bars to list them from the largest and a line for the accumulated ratio.
Purpose
Implement the “Prioritization” concept to start from the problem that has the largest impact
Example

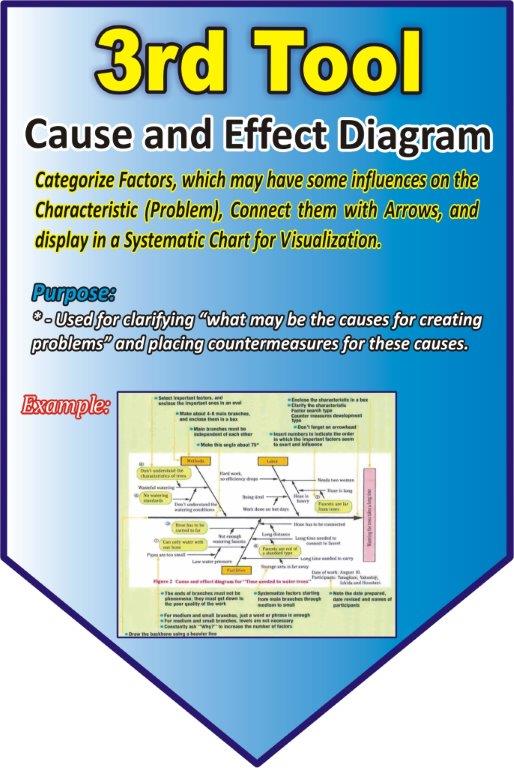
Causes and Effect Diagram
Categorize factors, that may have some influences on the characteristic (Problem), connect them with Arrows, and display them in a systematic chart for visualization.
Purpose
Used for clarifying “what may be the causes for creating problems” and placing countermeasures for these causes.
Example
Scatter Diagram
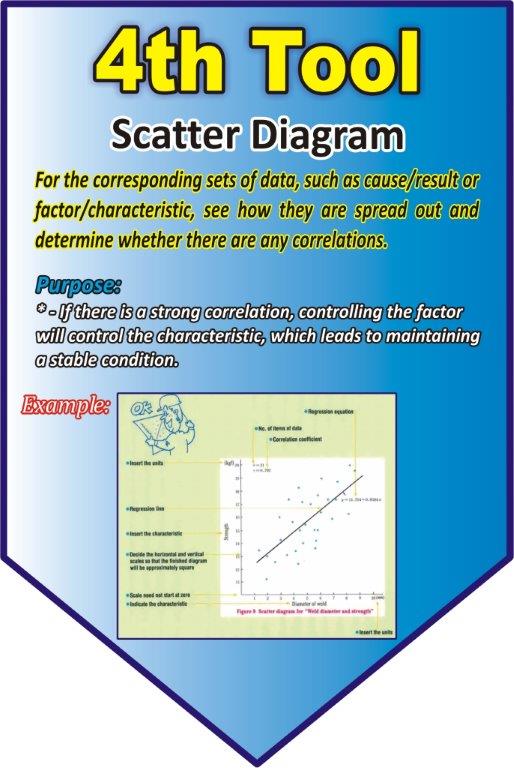
For the corresponding sets of data, such as cause/result or factor/characteristic, see how they are spread out and determine whether there are any correlations.
Purpose
If there is a strong correlation, controlling the factor will control the characteristic, which leads to maintaining a stable condition.
Example
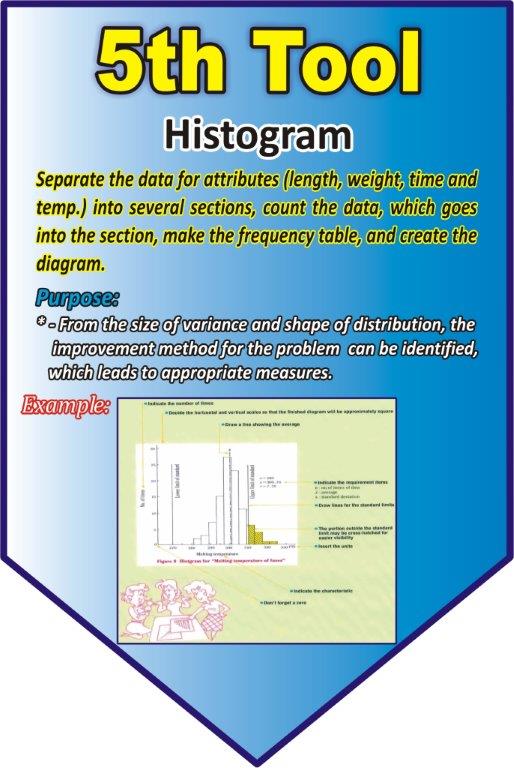
Histogram
Separate the data for attributes (Length, weight, time and temperature) into several sections, count the data, which goes into the section, make the frequency table, and create the diagram.
Purpose
From the size of the variance and shape of the distribution, the improvement method for the problem can be identified, which leads to appropriate measures.
Example
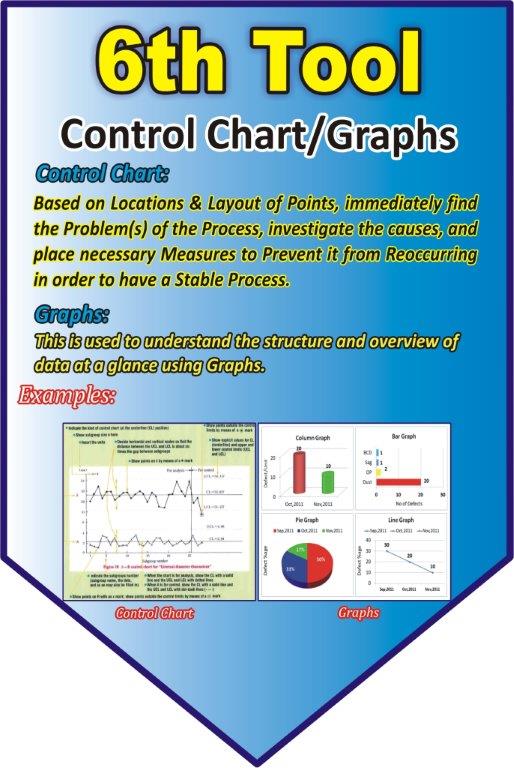
Control Charts/Graphs
Control Chart
Based on locations and layouts of Points, immediately find the problem of the process, investigate the causes, and place necessary Measures to prevent it from reoccurring in order to have a stable process
Graphs
This is used to understand the structure and overview of data at a glance using Graphs
Example
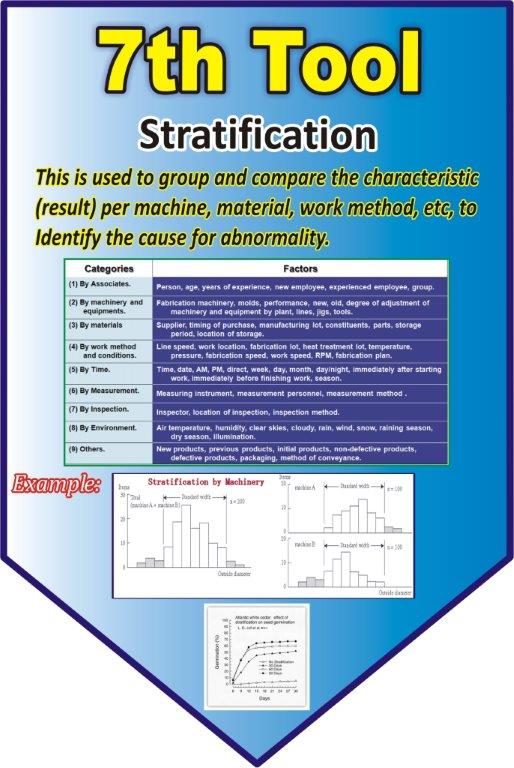
Stratification
This is used to group and compare the characteristic (Result) per machine, material, work method, etc. to identify the cause for abnormality.
| Categories | Factors |
| By Associates | Person, age, years of experience, new employee, experienced employee, group, |
| By Machinery and Equipment | Fabrication machinery, molds, performance, new, old, degree of adjustment of machinery and equipment by plants, lines, jigs, tools. |
| By Materials | Supplier, timing of purchase, manufacturing lot, constituents, parts, storage, period, location of storage |
| By work method and conditions | Line speed, work location, fabrication lot, heat treatment lot, temperature, pressure, fabrication speed, work speed, RPM, Fabrication plan |
| By Time | Time, Date, AM, PM, Direct, week, day, month, daytime, immediately after starting work, Immediately before finishing work, season |
| By Measurement | Measuring instrument, measurement personnel, measurement method |
| By Inspection | Inspector, Location of inspection, Inspection method |
| By Environment | Air, temperature, humidity, clear sky, cloudy, rain, wind, snow, raining season, dry season, illumination |
| Others | New products, Previous products, Initial products, non-defective products, defective products, packaging, method of conveyance. |
